One of my first JavaScript projects! This was an interesting project – watch out Google Maps, this might just be about to take you down… with a lot of additions.
If you want an easy way to create a map in JavaScript and display it on your website, then this might be a good way to do it. The final result is a map that you can embed into your website and place pointers, popups and shapes over. Quite cool!
You can see my final product here! This is how it looks in-browser.

The first step is to create a new HTML file and simply create a div in the body area, like so:
<body>
<div id="mapid"></div>
</body>
That will create the container that the map will sit in, so with that done it’s time to define your map using this JavaScript code. In this example, I used JavaScript inline with HTML which isn’t the best practice, if you wanted you could reference an external JavaScript file. Open up a <script> tag and copy the following into it.
var mymap = L.map('mapid').setView([52.67296, 1.29295], 13);
Using that code you can set the starting coordinates of the map. I’ve set mine to open the map at coordinates 52.67296, 1.29295 which is Norwich (where I live), but you could specify something different.
The next thing to do is to look at the CSS. Tutorials online will recommend that you reference a style sheet that is hosted online, but if you want to actually edit the style sheet to start customising your map, you will need to make your own style sheet and reference it in your HTML. If you click on this link here, you can see the contents of my style sheet for this project. You can create a new *.css file and copy the contents of my style sheet into your document, then link the style sheet you created to in the head area of your HTML document.
<head>

<link rel="stylesheet" type="text/css" href="style.css">

</head>
Make sure you put the correct location of your CSS file in there – I put mine in the same directory as my HTML document, but if yours is elsewhere you’ll need to put the correct link in.
Everything we do now is either in CSS or JavaScript – this project uses very little HTML.
In your the <script> tag that you created in your HTML document, copy and paste the following code into it:
L.tileLayer('https://api.tiles.mapbox.com/v4/{id}/{z}/{x}/{y}.png?access_token=pk.eyJ1IjoibWFwYm94IiwiYSI6ImNpejY4NXVycTA2emYycXBndHRqcmZ3N3gifQ.rJcFIG214AriISLbB6B5aw', {
maxZoom: 18,
attribution: 'Map data © <a href="http://openstreetmap.org">OpenStreetMap</a> contributors, ' +
'<a href="http://creativecommons.org/licenses/by-sa/2.0/">CC-BY-SA</a>, ' +
'Imagery © <a href="http://mapbox.com">Mapbox</a>',
id: 'mapbox.streets'
}).addTo(mymap);
And close the script tag. This is basically the code to display the map in your browser. If you used my style sheet (which scales the map to full screen using CSS, more on this later) and this code, when you open the HTML document you will see the following in your browser.
That’s the basic map done! Let’s have a look at some of the additional features you can add to the map to extend its functionality.
You can add popups to the map to mark places of interest, simply insert the JavaScript code below in between the <script> tags:
var popup = L.popup()
 .setLatLng([51.508478, -0.125147])
 .setContent("Text to display here!")
 .openOn(mymap);
That will display a popup at those coordinates on your map. The user can close the popup by clicking on the little X button in the upper right corner of the popup.
You can make popups appear when users click on certain objects on the map, or click on certain coordinates. A good use of creating popups may be to show the user the longitude and latitude coordinates of the point on the map they have clicked on. The function below will bring up a popup showing this whenever the user clicks on the map.
function onMapClick(e) {
 popup
 .setLatLng(e.latlng)
 .setContent(e.latlng.toString())
 .openOn(mymap);
 }

mymap.on('click', onMapClick);

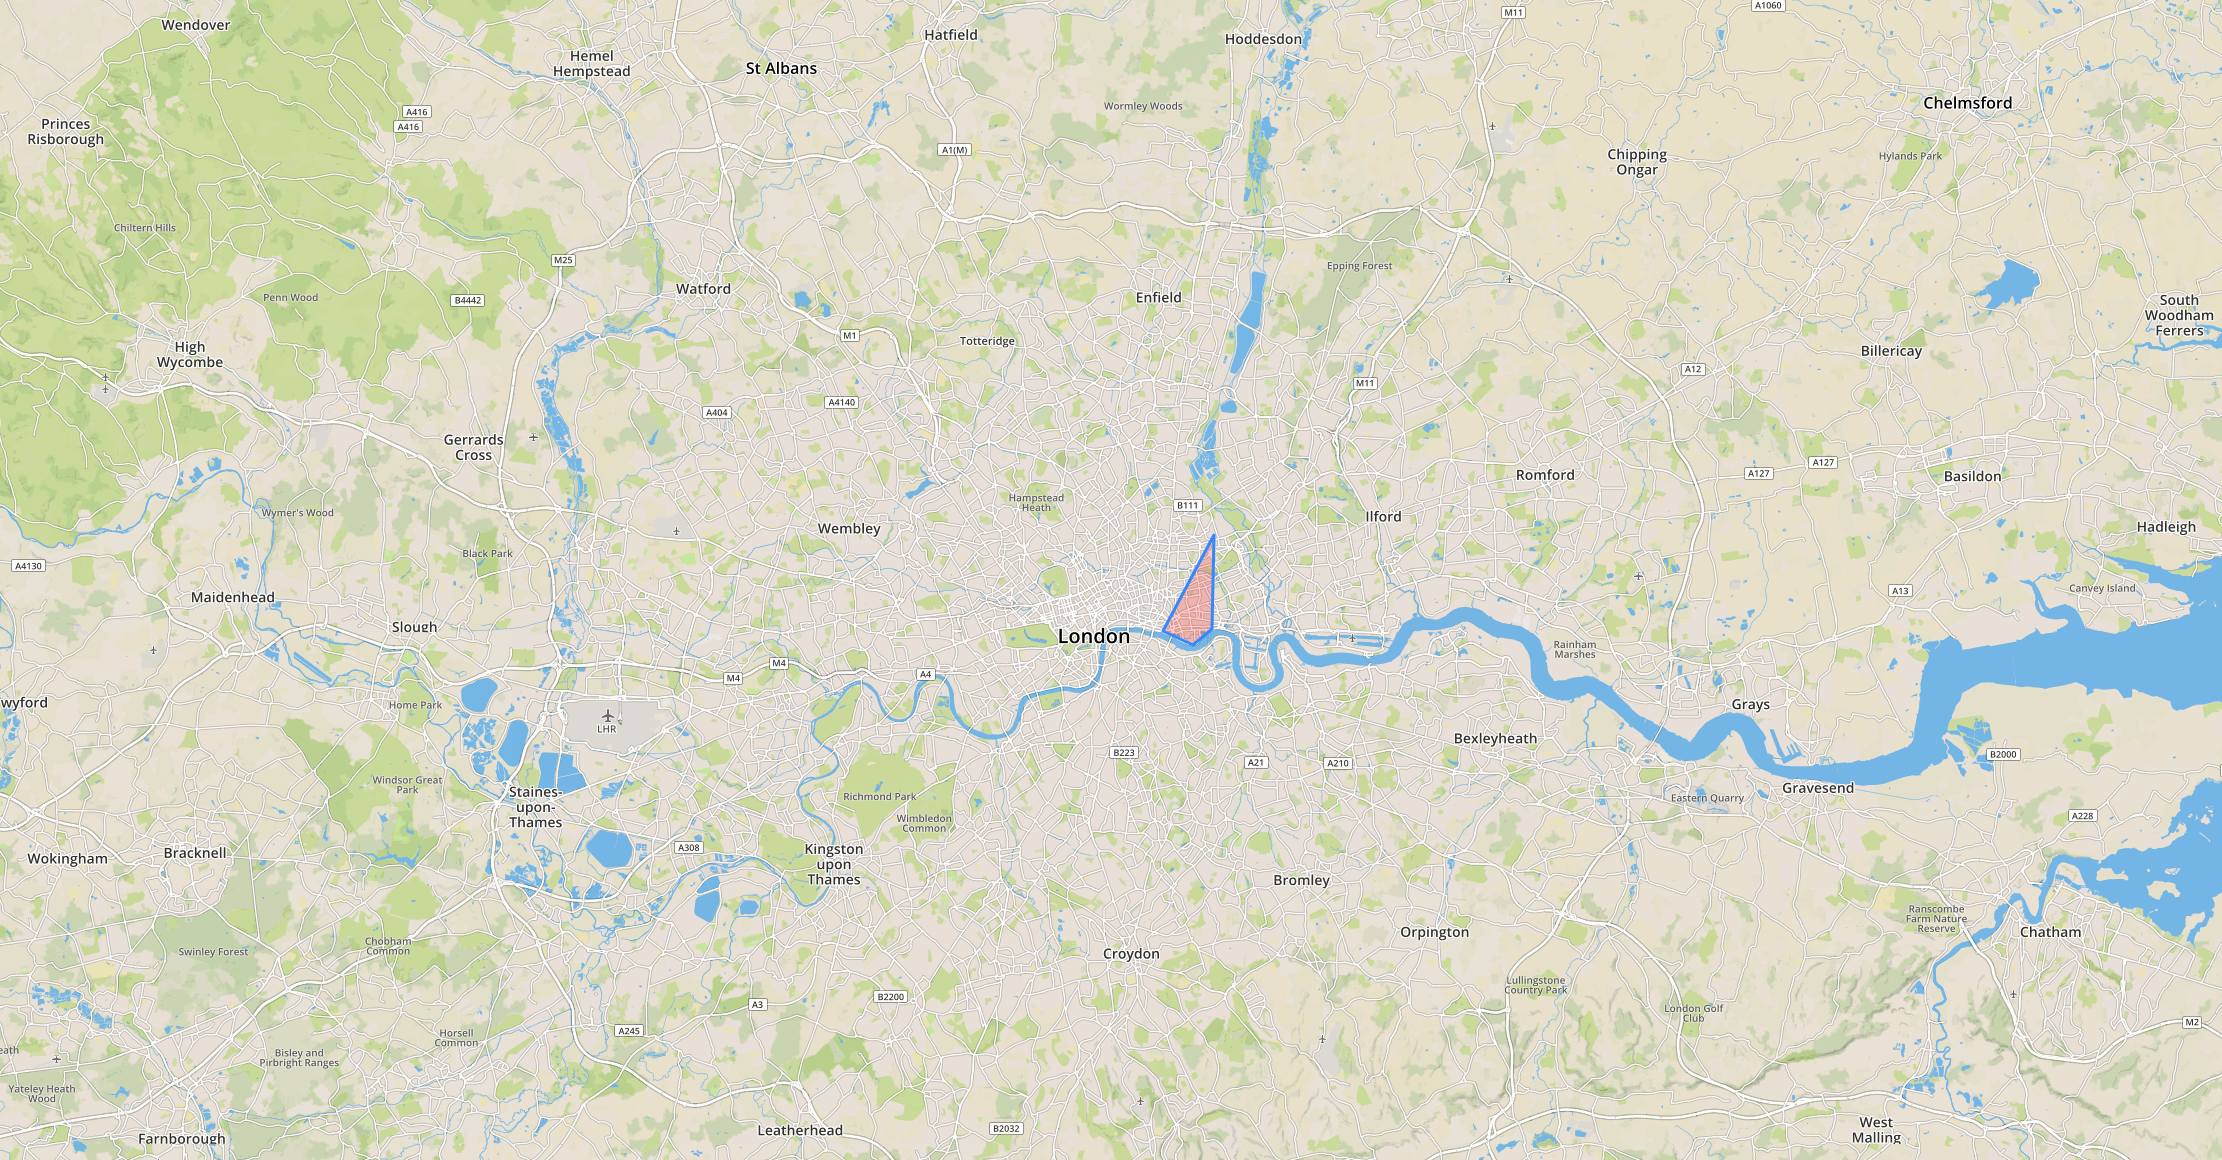
If you want to mark an area of a map to draw it to the users attention, you can do this using a polygon which has points at desired coordinates. Polygons can be filled with colour, too. See the code below for an example:
var polygon = L.polygon([
 [51.509, -0.08],
 [51.503, -0.06],
 [51.51, -0.047],
 [51.55, -0.045]
 ]).addTo(mymap);

polygon.setStyle({ fillColor: 'red' });
This code will create a red five-sided polygon, five sides because it has five coordinates where the edges meet. You can make polygons as big or as small as you please and they can have an unlimited number of sides.

Earlier, I talked about making the map scale to screen size in CSS. It’s already in my style sheet, but if you wanted to know what the code is – or wanted to know what to look for in my style sheet to remove it, the code is below. You can place this anywhere in your CSS style sheet.
body {
 padding: 0;
 margin: 0;
}

html, body, #mapid {
 height: 100%;
 width: 100%;
}
By making the width and height 100%, the map will scale to mobile devices too which makes for a more pleasant mobile experience. See the screenshot below, taken on a 5″ 1080p Nokia Lumia 930 smartphone running Windows 10 Mobile and displaying the map in the Edge browser.

The user can use their fingers to scroll and pan around the map on their mobile device. Like on a desktop browser, if the user taps on the screen a popup showing the longitude and latitude coordinates of the position on the map where they have tapped appears.
If you choose to remove this, you can specify the dimensions of your map simply by adding a ‘width’ and ‘height’ property to the first line of code mentioned in this article, see below.
<div id="mapid" style="width: 600px; height: 400px;"></div>
That will make the map 600px by 400px.
That’s all really! Leaflet is an easy-to-use, expandable way of creating a map using JavaScript!