It’s been a few weeks since I’ve written a reflective journal and this one is mainly going to be about rounding off the Nellie’s Nursery prototyping stage for the time being and implementing Google Analytics into Elebase 4, which is the latest version of the Nellie’s Nursery prototype.
I doubt I’ll be able to write the entire article like this, but this part of it at least has been written on my brand new phone! A Samsung Galaxy S8! I’ve bought a Samsung DeX Station for it which is a docking station that allows you to plug a keyboard, mouse, monitor and Ethernet cable into your Galaxy S8, S8 Plus, S9 or S9 Plus and effectively transform it into a desktop PC! I have to say that I am impressed by the performance given that I am essentially now using my smartphone as a desktop computer! I did actually have a Continuum HD-500 dock for my Microsoft Lumia 950 XL when I owned one of those, but I never actually used it or tried it out which is a bit of a regret given that I now can’t compare DeX to Continuum. Using the Continuum dock would have essentially transformed Windows 10 Mobile on my 950 XL into something resembling Windows 10 that you see on desktop computers and laptops, but given that many reviews of Continuum say that ‘it’s not ready’ and ‘nice, but flawed’ and people have been so impressed by DeX that they some are even considering ditching their desktop PCs, I’d say that the DeX experience is possibly superior. Before I go too far off-course with this, yes, I did finally replace my aging Nokia Lumia 930 with the Samsung Galaxy S8 that I said I would buy. About time too – loving it!
Check out my views on the Samsung DeX below!
Additional improvements to Elebase 4
There were some improvements added to Elebase 4 last week after the initial ‘What’s new in Elebase 4?‘ post was published on April 8th. The noticeable changes are:
- The user can now tap on the text container or the feature image to close the hamburger menu on the mobile site. This has been done by adding a click event listener to the text container and feature image using jQuery which collapses the hamburger menu if the user clicks or taps on one of these elements.
- An HTML 5 preloader has been added to each page to assist loading assets (such as scripts and images), further improving page load times.
- Due to the nursery being busy during the Easter holiday break, I was unable to visit and take my own photos. There may be an opportunity to do this at another time in the near future, but for the time being stock photography is being used on the site. These images are all copyright-free.
- The featured image is now different on each page, with the animated hero image only appearing on the home page and the other pages having relevant hero images.
- For the time being, the clouds animation has had to be disabled because on some mobile browsers (such as Google Chrome on the Samsung Galaxy S8), the clouds moving to the right of the browser menu was making the page wider and thus moving the menu buttons at the bottom of the screen on the mobile site so far to the right that the user was no longer to access them. This was happening despite the relevant CSS overflows being disabled on the text container and body elements. It would appear that some browsers cannot interpret the overflows correctly, meaning that this was a big enough problem that the clouds animation had to be disabled. I can see it being enabled again in the future in one or two ways:
- Using a media query to only run the animation on desktop browsers (which had no problems).
- Changing the animation to a simple fade in/out and/or expanding of the clouds (that will work fine on both desktop and mobile platforms).
- Using a media query to run different animations on different devices (this would take the most work and thus seems the least likely).
- The collapsible sections on the Groups page are better to use now because clicking on a button to open a section closes all of the other open sections, meaning that only one section can be open at once now so only the requested information is shown (which was the idea of using collapsible sections in the first place).
- The hamburger menu on the mobile site now features rounded edges in the top left and right corners just like the text container on the desktop and iPad websites and it also features an orange border to distinguish the white hamburger menu from the white text container it is displayed on top of.
- Less exciting, but the footer has now been applied to the Groups page (it was missing from this page before).
All of these improvements were implemented between April 9th and April 15th 2018. I want to stress that these additional improvements do not make Elebase 4 ‘Elebase 4.5’ or ‘Elebase 5’, rather they complete the development of Elebase 4 which was shown quite early on in its development as a very early prototype.
Unfortunately the copy is still largely Lorem Ipsum as I haven’t been able to obtain the appropriate copy for the website and there are still only three functional pages.


Monday 16th April
Lack of content and a massive over-reliance on Lorem Ipsum and stock photography aside, functionality-wise Elebase 4 (the latest version of the Nellie’s Nursery website prototype) is almost complete. Today was all about implementing Google Analytics code and deciding what to track. I discussed the use of Google Analytics in great detail back in January when I was writing about my web analytics project, so to read my thoughts about what to track on a website and why to track, read my post about that. Essentially for a site like the Nellie’s Nursery website I think the best use of analytics is to:
- See which pages are visited the most to see where users expect to find information.
- See how long users stay on pages – the longer they stay on a page either the more engaging the content is or the the harder the information that they are looking for is to find.
- See the order in which users visit pages – do they naturally go to a certain page after visiting the home page?
- Find out more about your visitors by seeing which sources they come from to access the site, e.g. discover if most of your visitors are coming from a direct link, search engine or social media platform
- Find out more about the devices and software that your visitors are using to visit the site so that the site can be optimised in the future for the most common hardware and software that is used to access the site.
All of these can be used to improve the site in some way or another, whether it be from an information heirarchy perspective, a device and software compatibility or just a general improvement in user experience. Google Analytics collects, records, displays and analyses all of the factors above by default without any additional coding or effort required. However, by default it doesn’t track events – basically recording every time a visitor presses a button or rolls over a picture or any kind of action really! Information about events can be sent to Google Analytics via a JavaScript function which is very easy to understand and code. Tracking events can help to determine whether features on a website are obvious to the user or to see if the user is utilising features.
I will add tracking events to the:
- Menu buttons on the desktop and mobile sites to see which buttons are pressed the most.
- The home, hamburger and contact button in the bar at the bottom of the mobile site to see how well these buttons are utilised and whether it is useful or not having the home and contact buttons outside of the hamburger menu for ‘quick access’.
- Text container and hero image to see if the user instinctively taps on either of these to close the open hamburger menu on the mobile site.
- Character animation buttons to see if the users think to tap/click on the character icons in the hero image to play the animations.
- Slideshow buttons to see if the users think to advance the slides on the slideshows.
Collecting this data will help to evaluate how inutitive the interface is to use and whether my calls to action are obvious enough to the user. If a button is a useful feature (in my opinion) but has very few clicks, then perhaps the design of the site does not lend itself to the user naturally just clicking on that button.
It’s very easy to add Google Analytics to the site. Initially, the following HTML is required in the head section of each page.

Replace the highlighted ‘xxxxxxxxx’ with the site’s unique Google Analytics tracking code which Google provides. This code here will count page views, record bounce rates, tell you device and software information, record acquisition channels and more to Google Analytics. What it doesn’t do is send tracking events, for example specific button clicks cannot be tracked. For that, a little JavaScript is required.
Either in its own JavaScript file that is later passed into other JavaScript files or at the top of each and every JavaScript file that will send tracking events, the following function is required.
/*Google Analytics function*/
    function sendTrackingEvent(action, label) {
        ga('send', 'event', 'Button Press/Tap', action, label);
    }
This function called ‘sendTrackingEvent’ sends a string called, ‘event’, ‘action’ and ‘label’ to Google Analytics, which appear as the event name, action name and label name in the Google Analytics web panel – all will be clear when you see the screenshot below.
Each element that has a tracking event attached to it needs to have this syntax:
 $('#home').click(function (e) { //navigate to index.html when user clicks on home button (desktop only)
        sendTrackingEvent('Home desktop button', 'Pressed');
        location.href = 'index.html';
    })
In the example above, when the user clicks or taps on the home button, the function ‘sendTrackingEvent’ is activated and the ‘action’ string is populated with ‘Home desktop button’ (the name of the button that has been pressed) and the ‘label’ string is populated with ‘Pressed’, which is the action that the user has completed. Strictly speaking I probably have put these the other way round (that would have made more sense) but it doesn’t matter too much since you can have any string you want. You should use string values that are easiest for you to understand.
The result in the Google Analytics panel is shown below.

In this provisional data that I generated by pressing on a few buttons on the site you can see that the most common event was hiding the hamburger menu on the mobile site by tapping, shortly followed by playing an animation) by clicking on one of the characters in the animated hero image.

Events data can be filtered by category, for example looking at the Event Action category it is possible to see that tapping on the text container was the most common action in this small data sample. Playing the lion animation was also a common event but clicking/taping on the Team button on the mobile site was the least common event action.

The Event Label category in this example actually tells us the actions such as ‘Pressed’, ‘Tapped’ and ‘Played’. I should probably alter my analytics code to swap the action and labels around to make viewing the content in Google Analytics a little more logical.
There are just a few pieces of sample data to demonstrate how event tracking can provide data and useful insights in Google Analytics. There will be analysis of real-world data in the coming weeks.
Tuesday 17th April
Not much happening on the code of Elebase 4 today, for the time being things are going on hold with the code whilst I focus on the next stages of the project which are collecting real-world analytics data to make suggestions to improve the usability of my prototype to [possibly] develop a version of the website that could be released to market in the coming weeks and also to consider the 2,000 business report.
I will be trying to work on both at the same time but essentially my plan is to just modify my JavaScript code for the analytics data a little bit to make event action and labels data appear correctly in Google Analytics and add tracking to the slideshow buttons and then send the URL to several friends of mine (likely those tested Elebase 3 in March and MP1 and 2 in February) and give them several days to try the site out on a variety of devices to get the data coming in. I might also ask them for some feedback on how the site is looking now which could be like an ‘unofficial’ Elebase 4 April 2018 prototyping session (to go with the February and March sessions). If I were to do this, to keep the feedback structured I would create a form in Microsoft Forms or Google Forms or similar just so that my testers had the opportunity to answer the same questions and provide feedback on the same topics. Questions would likely be similar to that used in my previous testing, but will also take into account the considerations that I made for future testing after the March 2018 testing session had been completed. Any information collected by this feedback and Google Analytics data can be used to develop an ‘Elebase 4.5’ or ‘Elebase 5’ providing the nursery are keen for me to continue development.
Whilst several of my friends are providing daata, I will consider the 2,000 business report which essentially is a report that outlines the aims of creating the nursery website, the design principles that have gone into making it (backed up with primary and secondary research), the findings of the two or three sets of user testing and suggestions for going forwards with the website. Essentially it is a condensed version of these reflective journals that I have been writing almost every week since January 8th featuring a little more research and written in a more formal style. My course tutor briefed me on this business-style report that I will be writing over the coming weeks. A first draft is expected by the end of Friday 27th April, so I will need to do some time management to balance creating this draft, collecting and analysing analytics data, possibly making some small further tweaks to Elebase 4 and potentially visiting Nellie’s Nursery to show them the work that has been completed and take photographs for the website. I have a feeling that they will want me to continue development of this website beyond the official end of this project on May 11th, after which the development of the site will not be supported by NUA and will become a private project like Storehouse and several other projects I am already working on or have planned. Among all of this, I also need to publish a reflective journal too.
On a slightly-related note, on the 16th I pulled the trigger on a Samsung Galaxy S8 and today it arrived. It’s nice owning a beautiful, modern smartphone. I feel that the S8 (or any phone really given that I was upgrading from Windows 10 Mobile) was a very worthy investment and will help me with my UX course. I am now able to test my work on a modern, commonly-used browser and handset and test my work in four different browsers, namely Chrome, Firefox, Samsung Internet (which now holds more market share in Asian markets than Internet Explorer!) and Edge which Microsoft has recently released for Android. Previously, without having to borrow an iPhone or an Android handset, I could only test my work in Edge and Mobile Internet Explorer, but now I will only have to occasionally borrow an iPhone to test my work in Safari. That’s OK since I can borrow an iPhone 7 at any time from uni and my brother owns an iPhone 6 Plus that he is very good at lending to me when I need to test something on it! The S8 with its 5.8″ display is on the larger side of screens, but with the average screen size probably being anywhere between 5″ and 5.8″ in the UK now, soon it will definitely have an ‘average-sized display’. In April 2018 I’d say that anything with a display of 6″ or above is definitely above average. No doubt I will write a piece about my thoughts on Android and the S8 compared to Windows 10 Mobile and the Lumia 930 once I’ve owned the S8 for a while and any ‘honeymoon feelings’ are over, but so far I am very satisfied and believe that me it is the right tool.

Wednesday 18th April
For me, today was all about promoting my course. I spent the morning participating in the NUA Applicant Day as a tour leader and showed potential BSc UX, IxD and Games Development students around the NUA campus, showing them the facilities that are on offer at the university and also introducing them to the course leader and showing them the lab that they’d be working in. They seemed to enjoy the tour and be keen to study at NUA from September, so it was great to be involved with this!

Later on I visited the UEA to talk to Norfolk A level/T level/BTEC computer science teachers about encouraging their further education (aged 16-18) students to consider doing a BSc degree at NUA. I told them exactly what each course entailed and how they related to art and computer science subjects at A level. I think I did a good sales pitch so I hope that in the coming years we will see more and more students join the BSc courses as we work as hard as we can to promote them and make sure that local and regional schools are aware of them. I am attending an event at Chelmsford College next week to do a similar kind of thing and I am for two days in Birmingham in June to talk about BSc courses at a UCAS day. I’m truly passionate about NUA and its new BSc courses and will do anything to help the university promote the courses to get the next generation onboard. The creative industries are turning more creative, I’ve seen it first-hand: graphic design students are getting more interested in tech and how they can utilise it. These courses at NUA are the future. I’ve written my full opinions in this post as to not distract from the point of this post, so if you are interested take a read of that!

Thursday 19th April
Having gone believably off-track discussing the ins-and-outs of the next generation of technical students in the UK, I drew my focus sharply back to my work today. I’ve actually spent most of today reflecting on the past week and writing about my work.
Going back to my thoughts on Tuesday about doing some informal user testing whilst also generating data for the analytics, today I made a small Microsoft Forms survey for people to answer after they had freely browsed my prototype. Think of it like a testing session where no specific task is set and then the users answer some questions afterwards. The format of the survey follows the criteria that I laid out for future testing after the Elebase 3 testing was completed, meaning that the questions focus on more aspects other than the ease of navigation. I can’t sit down and have a personal face-to-face interview with each tester and I don’t have much time to analyse data, so I have made the survey was quick as possible to answer and using star ratings and ‘scales of 1 to 5’ to give quantitative data that can be graphed and charted easily and easy to compare (theoretically). There are some questions which provide the tester with an opportunity to say a little more and provide some qualitative data too.
The downside of collecting qualitative data by using opinion-based ratings is just that – opinions. What one person might think is a 2/5, another might think is a 5/5. I guess if you collect a lot of data and most results show say a 3/5 then you know it’s about average, but if a lot say 1/5 and a lot say 4/5, you may decide that something is like marmite and/or decide that around 2/5 or 3/5 is the general feeling. For the scale of this project, the lack of objectiveness probably isn’t a massive deal but if I was doing this for industry I’d be more concerned about the accountability of data collected in this way.
Before the URL is distributed to testers I still need to modify the Google Analytics code to show the event categories and labels in the correct places on Google Analytics.
Friday 20th April
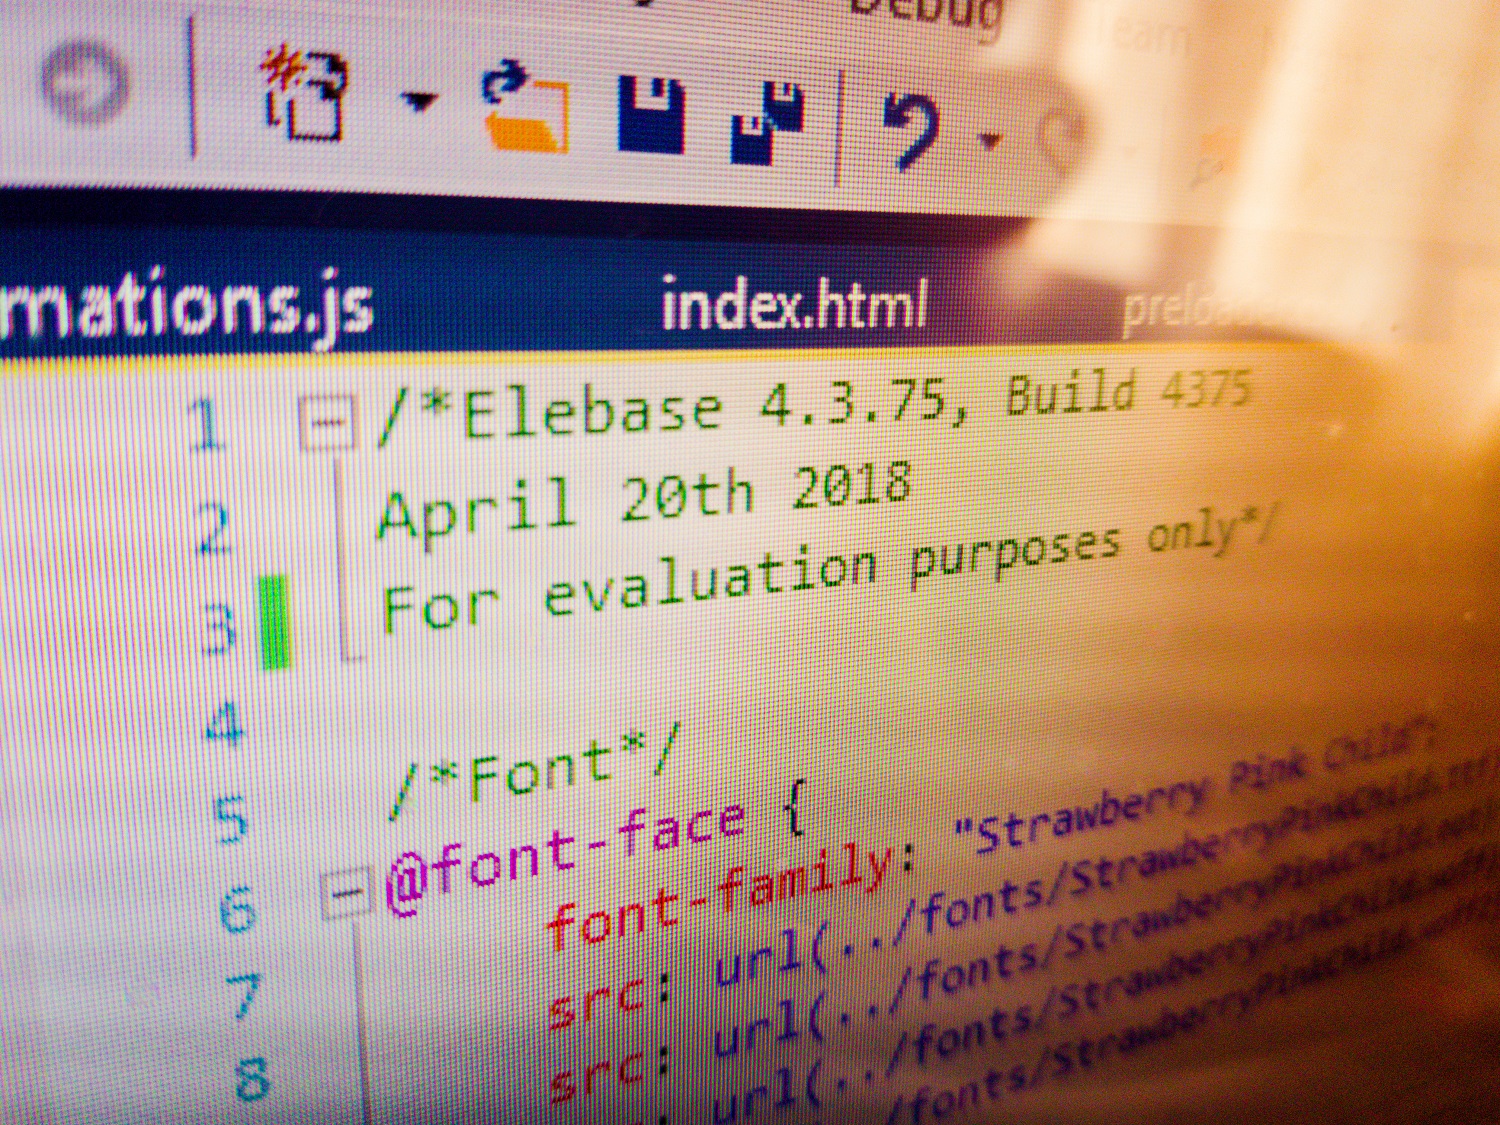
Today I finalised the analytics code and also added tracking events to the collapsible sections on the groups page. I also reinstated the clouds animation which now use the same animation that the loading animation does (the clouds gradually get bigger and then smaller). By using this animation instead of the previous one where they move across the screen, the clouds animations now have no negative impacts on the mobile browsing experience. The latest build of Elebase (Build 4375) is now uploaded to my secure web space and is ready to be tested and analytics data collected.
I also finalised the survey which will be sent round to the testers. An embedded version of the survey can be seen below.
The survey aims to capture information about the devices used, the browsers used (although Google Analytics will already be recording this) and asking users’ thoughts on the appearance of the site as well as the information architecture. If most of my testers come back and speak positively about the site appearance and the information architecture then I know that generally I have done a good job and know what to do going forwards. If the opposite is true, I know it might be time to go back to the drawing board. It will be interesting to see what data comes back from this smaller-scale user testing session.
I will start distributing the URLs for the project work and survey on Monday April 23rd. Testers will be a group of my friends and those who have previously tested older versions of Elebase as well as contacts that my family have at their places of work. I may also use some of my own contacts from NUA’s marketing and administration departments to get as many people testing the site as possible.
Visit to Nellie’s Nursery and Elebase 5?
On Wednesday April 25th I am visiting Nellie’s Nursery to take some photos for the website and also to discuss content and copy for the site and get the nursery’s opinion on the latest version of the site. It seems that they are keen for me to develop Elebase 4 into a fully-fledged website even beyond the end of this project which I am happy to do and support. Elebase’s code is so similar to Storebase’s that maintaining the two side-by-side will be easy and I intend to keep developing these two frameworks, possibly trying to unify them over the summer break and then use this unified framework (which will no doubt be called ‘something’-base) to rebuild some of my oldest websites, such as the BrownTech IT Services website which was written back in March 2014 and the Bidwell Joinery website which hasn’t seen a significant update since August 2014 and was made using Adobe Muse which will be deprecated in under a year’s time (a sad day for creatives who want to build a website with no code, but Adobe promises us that soon Muse’s functionality will be available in XD).
I can see Elebase 5 being developed after May 11th when this project is officially over. I think if there is an Elebase 5 then that’ll be the one that goes to market. After all, 5 was the lucky number for Storebase with Storebase 5.5.5 being the RTM release.

2 Comments on “Reflective Journal and Production Diary – 16-20th April 2018”
Comments are closed.